B2B strategy
B2B analytics on Shopify: the quote metrics that matter
By Jahangir Alam · August 20, 2026 · Updated August 23, 2026 · 13 min read
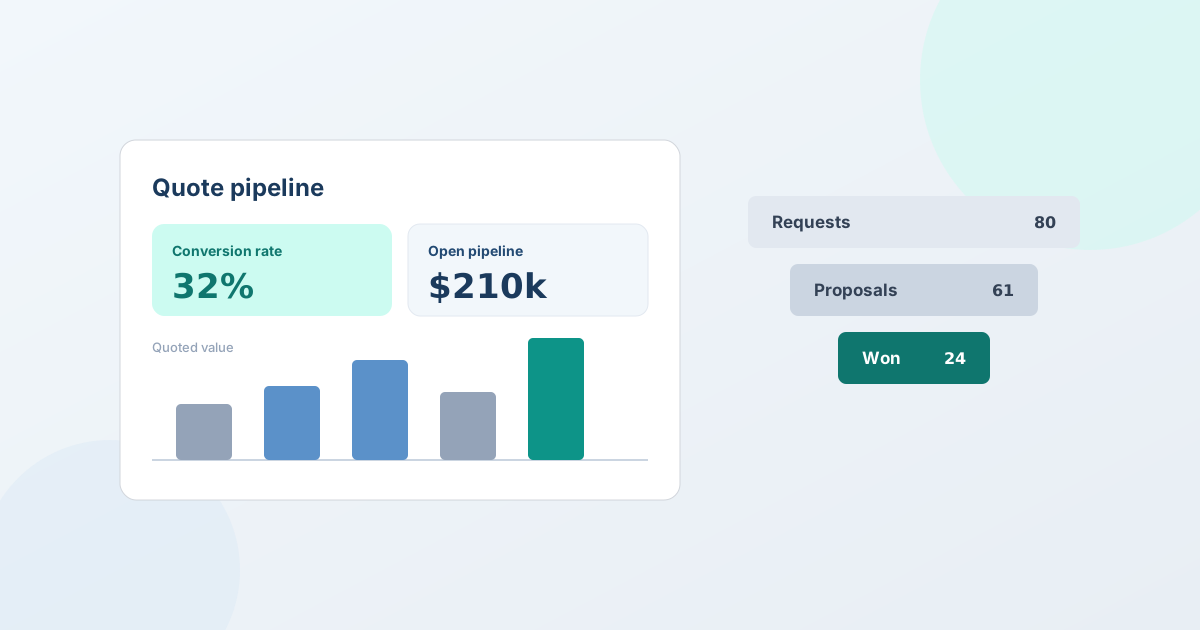
You can't improve what you don't measure - and B2B quoting has metrics a retail dashboard never shows. How many of your quotes actually turn into orders? How long do they sit before someone decides? Which companies are worth the most to your pipeline, and how much revenue is open right now, waiting on a yes? Standard Shopify analytics can't answer any of that, because they start counting at the order - and a B2B deal lives almost entirely before the order exists. This is a complete walkthrough of the B2B quote metrics that matter on Shopify: what each one means, how to read it, how to improve it, and how to track them all without a spreadsheet.
Why B2B quoting needs its own analytics
Retail analytics answer one core question: of the people who landed on the store, how many bought, and for how much? Sessions, conversion rate, average order value, returning-customer rate - all of it is anchored to the storefront and the completed order. For a store that sells fixed-price products to individual shoppers, that's exactly the right lens.
B2B quoting doesn't work like that. The order is the last step, not the first. Before it there's a request, a priced proposal, maybe a counter-offer or two, an approval, and a decision. That whole pipeline - where most of the value and most of the risk actually sit - is invisible to storefront analytics, because none of it is an order yet. A quote that's been open for three weeks, a $40,000 proposal waiting on the buyer's finance team, a company that requests ten quotes a month but converts only two: standard reports show you none of it.
Measuring B2B properly means measuring the quote lifecycle itself - the pipeline from request to won-or-lost. Do that, and you can answer the questions that actually run a B2B business: Is our quoting getting better or worse? Where do deals stall? Which accounts deserve more attention, and which are quietly costing us time? The rest of this guide is the metrics that describe that pipeline, and what to do with each one.
The B2B quote metrics that matter
There's no shortage of numbers you could track. These are the ones that change decisions.
Quote conversion rate
What it is: the share of quotes that become orders. If you sent 80 quotes last month and 24 converted, your conversion rate is 30%.
Why it matters: it's the single clearest measure of how well your quoting is working end to end. It rolls up pricing, responsiveness, product fit, and follow-up into one number, so a change in conversion rate is usually the first sign that something upstream shifted - your prices got less competitive, your responses got slower, or a new buyer segment isn't the right fit.
How to read it: there is no universal "good" conversion rate - it depends on your industry, how qualified your requests are, and whether you quote widely or selectively. So don't chase a benchmark you read somewhere; track your own trend. (What the published B2B quote benchmarks actually say traces where those figures come from - most have no disclosed sample at all.) A rate that's climbing means your quoting is improving; a sudden drop is a signal to investigate before it costs you a quarter.
How to improve it: speed is often the biggest lever (see cycle time below) - the fastest response frequently wins. After that, look at whether your prices are landing (a high decline rate near your list price says you're quoting too high; a high decline rate on deep-discount requests says the buyers aren't a fit), and whether quotes are expiring un-actioned because nobody followed up.
Win rate (and how it differs from conversion rate)
What it is: of the quotes that reach a decision, how many you win - versus the ones the buyer declines or lets expire. Conversion rate counts every quote in the denominator; win rate counts only the ones that got to yes-or-no.
Why both: the gap between the two is diagnostic. If your conversion rate is low but your win rate is high, the problem isn't your quoting - it's that too many quotes never reach a decision (they stall, they expire, nobody follows up - see how to follow up on a B2B quote). If your win rate itself is low, the problem is the offer: price, terms, or fit. Tracking them together tells you where to fix, not just that something's wrong.
Open pipeline value
What it is: the total value of every quote still in play - sent, countered, or awaiting approval, but not yet won or lost. If you have 35 open quotes worth $210,000 in aggregate, that's your open pipeline.
Why it matters: it's your forward view. Multiplied by a realistic conversion rate, it's a rough forecast of revenue on the table; broken down by age, it's an early-warning system. Pipeline that's growing while conversion holds steady is healthy growth. Pipeline that's growing because quotes aren't closing - piling up, aging out - is a warning, not a win.
Watch for: stale open pipeline. A $30,000 quote that's sat untouched for a month is usually not "still in play" - it's a lost deal that hasn't been marked lost yet. Aging your open pipeline (how much of it is over 14 or 30 days old) keeps your forecast honest.
Response time and cycle time
These are two different clocks, and both matter.
- Response time is how long from a buyer's request to your first priced proposal. In B2B this is frequently the difference between winning and losing: the vendor who responds first, while the buyer is still paying attention, has a real edge.
- Cycle time is the full duration from request to a won order. It tells you how long capital and attention are tied up in a typical deal, which matters for forecasting and for spotting bottlenecks - if cycle time is creeping up, something in the middle (approvals, negotiation rounds, buyer sign-off) is slowing down.
How to improve them: the biggest wins are usually structural - route new requests to an owner the moment they arrive so nothing sits unassigned, price the predictable ones with automation so a human isn't the bottleneck on routine work, and use proposal expiry plus automatic follow-ups so quiet quotes get a nudge instead of dying quietly.
Average quote value and quote volume
What they are: the typical size of a deal, and how many you're handling over a period. Together they describe the shape of your pipeline - lots of small quotes, a few large ones, or a mix.
Why they matter: a rising average quote value with steady volume means you're winning bigger deals; rising volume with a falling average might mean you're spending time on requests that aren't worth quoting. Segmenting these (B2B company vs wholesale vs DTC) shows you where your time is actually going, and whether it matches where the revenue is.
Top companies and top products
What they are: which accounts drive the most quoted value, and which items get quoted most.
Why they matter: B2B revenue concentrates. A handful of companies often account for most of your pipeline, and knowing which ones lets you prioritize response time and relationship investment where it pays off - and spot concentration risk before it bites (if one account is 40% of your pipeline, that's a dependency worth managing). Top-products data, meanwhile, is demand signal: the items buyers keep asking to be quoted are candidates for a standing price list, a bundle, or a stocking decision.
Why Shopify's standard reports don't cover quoting
Shopify's built-in analytics are excellent - for retail. They're built around the storefront and the order: sessions, conversion, average order value, returning customers, sales by product and channel. Every one of those metrics starts counting at, or after, a completed order.
The problem is that most of a B2B deal happens before there is an order. The request, the proposal, the counter-offers, the approval, the accept-or-decline - none of it is an order, so none of it appears in a sales report. By the time a B2B deal shows up in Shopify's standard analytics, it's already won; everything you'd want to manage - the open pipeline, the stalled quotes, the conversion rate, the response time - happened in a stage Shopify's reports don't see. That's not a gap in Shopify; it's just that order analytics and pipeline analytics are two different jobs. To manage quoting, you need reporting on the quote lifecycle itself.
How to measure quoting on Shopify
Since the standard reports stop at the order, you measure the pipeline with a quote app that records the whole lifecycle and reports on it. Here's how that works in QuotWay:
- Dashboard KPIs, on every plan. Conversion rate, quote volume and value, and pipeline at a glance - available on all plans, with a 7-day view on the free Lite plan and Starter, so you can start measuring your quoting from day one.
- Date ranges and CSV export (Professional and up). Choose any period - this month, last quarter, a specific campaign window - and export the underlying data to CSV to analyze it however you like or pull it into your own reporting.
- Per-company analytics (Enterprise, with a B2B-capable store). Split quote value and volume between B2B (company) and Wholesale/DTC, rank your top companies by quoted value, and filter the entire dashboard to a single company's activity. The top-companies breakdown is included in the CSV export. See Shopify B2B quoting for how company-aware quoting works.
- Mixed-currency reporting. If you quote international buyers in their own currency, totals sum in your base currency so your global pipeline reads as one honest figure rather than a jumble of currencies. See multi-currency quoting.
Underneath all of it is an append-only event log: every request, proposal, counter-offer, approval, and conversion is recorded in order, so the metrics are computed from what actually happened, not re-keyed by hand. See analytics and insights for the full feature. (Every number in this guide is illustrative - use your own data, not these figures, as your baseline.)
Turning the numbers into decisions
Metrics only matter if they change what you do. A few common readings and the move each one suggests:
- Conversion is falling, win rate is steady. Deals are stalling before a decision, not being lost on the merits. Tighten follow-up: add proposal expiry, turn on automatic reminders, and check that no requests are sitting unassigned.
- Win rate is low near your list price. Your quotes are landing too high for the market. Revisit your pricing or your floor - the point below which you won't go - and make sure reps aren't over-quoting out of caution.
- Response time is creeping up. A person has become the bottleneck on routine quotes. Route requests to an owner automatically and let automation price the predictable ones so humans spend their time on the deals that need judgment.
- Open pipeline is growing but so is its average age. You're accumulating stale quotes, not real opportunities. Age the pipeline, chase the recoverable ones, and mark the dead ones lost so your forecast stays honest.
- One company is a huge share of pipeline. That's concentration risk. Keep serving them brilliantly, but invest in diversifying the next tier of accounts so the business isn't hostage to one relationship.
- A product is quoted constantly. That's demand telling you to act - consider a standing price list for it, a bundle, or a stocking change so buyers don't have to ask every time.
The habit that matters is the loop: measure, change one thing, and watch whether the number moves. B2B quoting improves in exactly that increment.
Per-company and cross-currency reporting in more depth
For merchants running native Shopify B2B, per-company analytics are where the dashboard earns its keep. Because QuotWay ties company-aware quotes to the buyer's Shopify Company and Location, it can answer account-level questions retail analytics never could: which companies quote the most, which convert the best, and where a single account's pipeline is heading. Filtering the whole dashboard to one company turns a quarterly business review from a spreadsheet exercise into a click. This lives on the Enterprise plan with a B2B-capable store, alongside the company-aware quoting it depends on.
Cross-border sellers hit a second reporting trap: a pipeline quoted in five currencies isn't a number you can add up. QuotWay captures the presentment currency on each quote and reports totals in your base currency, so "open pipeline" is one figure you can actually forecast against, not a currency salad. The buyer still sees their own currency; your reporting sees one.
Ask Shopify Sidekick about your pipeline
If you'd rather ask a question than open a dashboard, QuotWay answers Shopify Sidekick - the AI assistant built into the Shopify admin - about your quotes. Ask it for your conversion rate, your win rate, open pipeline value, which quotes are awaiting approval, or your top quoted products and companies, and it answers from QuotWay in plain language. Sidekick reports and can open any quote it names, but never changes one - and it's available on every QuotWay plan, so pulling a metric is as fast as typing a sentence.
Common mistakes when measuring B2B quoting
- Chasing a benchmark you read somewhere. There's no universal "right" conversion rate or cycle time for B2B; the useful comparison is your own trend, not a stranger's number.
- Watching volume, ignoring value. Fifty small quotes and five large ones can produce the same "quote count," but they're completely different businesses. Segment by value, not just volume.
- Ignoring cycle time. Conversion tells you whether you win; cycle time tells you how much it costs to win. A high conversion rate with a punishing cycle time is a hidden problem.
- Never segmenting. Blended metrics hide the story. B2B company quotes, tag-based wholesale, and DTC behave differently - a blended conversion rate can look fine while one segment quietly collapses.
- Measuring but not acting. The dashboard isn't the point; the decision is. Pick one metric, change one thing, and check the result. Analytics you never act on are just decoration.
FAQ
What B2B quote metrics should I track on Shopify?
Track quote conversion rate (quotes that become orders), win rate (of decided quotes), open pipeline value, response time and cycle time, average quote value, quote volume, and your top companies and products by quoted value. Together they show how well your quoting converts, where deals stall, and which accounts to prioritize - none of which Shopify's standard order reports cover, because a B2B deal lives before the order.
Does Shopify have B2B sales analytics?
Shopify's built-in analytics focus on the storefront and orders (sessions, conversion, average order value), which start at the order - they don't measure the quote pipeline that comes before it. To report on B2B quoting - conversion rate, pipeline value, top companies - you use a quote app's analytics. QuotWay provides dashboard KPIs on every plan, date ranges and CSV export on Professional and up, and per-company analytics on Enterprise with a B2B-capable store.
What's the difference between quote conversion rate and win rate?
Conversion rate is the share of all quotes that become orders; win rate is the share of decided quotes (won plus lost) that you won. The gap between them is diagnostic: a low conversion rate with a high win rate means quotes are stalling before a decision, while a low win rate means the offer itself - price, terms, or fit - is the problem.
Can I see quote analytics by company?
Yes - on the Enterprise plan with a B2B-capable store. QuotWay's per-company analytics split quote value and volume between B2B (company) and Wholesale/DTC, rank your top companies by quoted value, and let you filter the whole dashboard to a single company. The breakdown is also in the CSV export.
Can I export my quote data?
Yes, on Professional and Enterprise. Set a date range and export the analytics to CSV, so you can analyze any period or pull the data into your own reporting. Lite and Starter show a 7-day dashboard view.
How do I improve my quote conversion rate?
Start with speed - respond first and fastest, since the earliest priced proposal often wins. Then check pricing (are quotes landing near your list price or getting declined?), and close the follow-up gap with proposal expiry and automatic reminders so quotes reach a decision instead of expiring. Measure the change against your own trend, not a benchmark.
Where QuotWay fits
QuotWay is a B2B quote and negotiation app for Shopify, built by EFOLI, that measures the pipeline retail analytics can't see: conversion rate, open pipeline value, top companies, and more, on a dashboard (every plan), with date ranges and CSV export (Professional and up) and per-company analytics (Enterprise with a B2B-capable store). It computes those metrics from an append-only record of every quote, and it'll answer Shopify Sidekick about your pipeline in plain language. The free Lite plan runs the full quote → negotiate → draft-order loop with dashboard KPIs, so you can start measuring your quoting today. See analytics and insights, the plans and pricing, or add QuotWay on Shopify.
Sources
Related articles
See how QuotWay handles this on your store.