B2B strategy
B2B quote benchmarks: what the published numbers actually say
By Jahangir Alam · August 23, 2026 · 11 min read
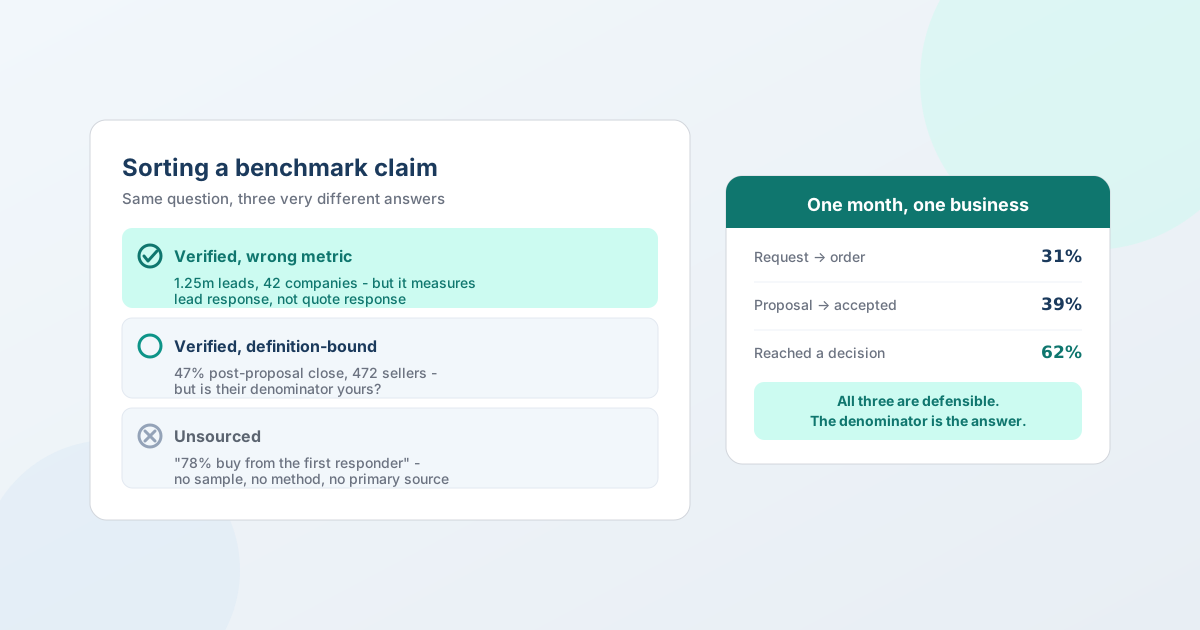
There is no published, methodologically-disclosed benchmark for B2B quote response time or quote-to-order conversion. Not for Shopify, not for B2B generally. The figures circulating are one of three things: rigorous research measuring a different metric, a survey whose denominator probably isn't yours, or a vendor number with no stated sample at all. This guide sorts them into those three piles, names the sources, and gives you the formulas to measure your own.
That's a less satisfying answer than "the benchmark is 30%." It's also the only honest one, and knowing which pile a number came from is worth more than the number.
How to sort a benchmark claim
Three piles, and almost every figure you'll encounter falls into one:
- Verified, but measuring something else. Real studies with disclosed samples - which measure lead response, the speed of first contact after an enquiry, not quote response, the time to return a priced proposal. Different clocks.
- Verified and relevant, but definition-bound. A real survey with a real sample, whose denominator may not match how you count.
- Unsourced. A number presented as an industry fact with no sample, no method, and no citation - often traceable only to other blogs repeating it.
The numbers that are real
These have published samples. Every one of them measures lead response, not quote response - which matters enormously, and is covered in the next section.
| Finding | Source | Sample |
|---|---|---|
| Contacting within 1 hour makes qualifying a lead ~7× more likely than an hour later, and ~60× more likely than after 24 hours | Oldroyd, McElheran & Elkington, The Short Life of Online Sales Leads, Harvard Business Review, 2011 | 1.25 million leads across 42 US companies (29 B2C, 13 B2B) |
| Average first response 42 hours; only 37% respond within an hour; 23% never respond at all | Same HBR study, audit component | 2,241 US companies, tested with real web enquiries |
| Contact odds ~100× higher and qualification odds ~21× higher calling at 5 minutes versus 30 | Oldroyd / InsideSales, Lead Response Management, 2007 | 3 years of platform data, 6 companies, 15,000+ leads, 100,000+ calls |
| ~8× higher conversion responding within 5 minutes versus 6+ | XANT / InsideSales, Lead Response Management, 2021 | 5.7m inbound leads, 55m sales activities, 400+ companies (2018-2020) |
| 391% conversion lift calling within one minute | Velocify, The Ultimate Contact Strategy, 2013 | ~3.5m leads, 400+ companies; skewed to phone-heavy verticals |
| Median phone response 3h 08m, mean 61 hours | InsideSales.com, 2014 | Secret-shopper audit of 9,538 companies |
| Only 7% of B2B SaaS companies respond within 5 minutes | Drift, Lead Response Report, 2017 | 433 B2B SaaS companies, tested on their own forms |
Note the dates. The most-quoted findings in this space are from 2007 and 2011. They may well still hold - the underlying human behaviour is unlikely to have reversed - but a figure that predates the current B2B ecommerce landscape shouldn't be presented as a 2026 benchmark, which is exactly how it usually appears.
The lead-response trap
Here's the substitution that makes most quote-response advice unusable.
Lead response time is how long until a human makes first contact after an enquiry arrives. Quote response time is how long until the buyer receives a priced, itemized proposal. These are different operations with different constraints:
- You can acknowledge a lead in five minutes. You cannot price a 40-line RFQ with custom tolerances in five minutes, and a "quote" produced that fast is a guess you'll have to walk back.
- Lead response is bounded by attention. Quote response is bounded by work - costing, stock checks, freight, sometimes an internal approval.
So when an article about quoting tells you to respond in five minutes and cites a study, the study is almost always about lead response. The advice isn't wrong so much as mis-specified: it's a real finding about a different metric, wearing your metric's name.
What survives the translation is direction, not magnitude. Faster is better, and the advantage is front-loaded - that holds across every study above. The specific multipliers are not transferable to quoting, and nobody has measured the quoting equivalents at scale.
The practical version: split the clock in two. Acknowledge fast (that is lead response, and the research applies directly), then quote as fast as the work honestly allows, and measure the two separately.
The numbers that are folklore
Three claims dominate this space and none has a traceable source.
"78% of buyers purchase from the vendor who responds first." Attributed across the industry to a "Lead Connect survey" that has no published report or methodology. Every citation traces to another blog citing a blog. It is the single most-repeated statistic in response-time content and there is nothing underneath it.
"35-50% of sales go to the vendor that responds first." Usually pinned to InsideSales, equally untraceable, and typically appears in the same paragraph as the 78% figure.
"The average B2B first response is 47 hours." A misquote. The audited figure is 42 hours (HBR, 2011). The corrupted version circulates more widely than the correct one - which tells you how much of this content is copied rather than checked.
And in the Shopify and quoting-software space specifically, the current crop:
"B2B manufacturers take 24-72 hours on average to respond to a quote request" and "the average B2B quote-to-order conversion rate is 20-35%" both appear on vendor sites presented as 2026 benchmarks. Neither discloses a sample size, a data source, a survey method, or a date range; the supporting line is "research consistently shows," with no citation. They may be directionally sensible. They are not evidence, and repeating them as such is how folklore gets minted.
We're naming these rather than quietly declining to cite them, because "there is no benchmark" is a claim that has to be shown, not asserted.
The one conversion figure worth quoting
There is one relevant, methodologically-disclosed number.
The RAIN Group Center for Sales Research surveyed 472 sellers and sales executives and found a post-proposal close rate of 47%, with the top 7% of performers at 73%. Their definition is explicit: the percentage of opportunities proposed or quoted that were won - counted from opportunities that reached the proposal stage, not everything that entered the pipeline.
That definition is the whole reason the figure is usable, and also why it probably isn't your number. If you quote every request that arrives, including the tyre-kickers and the RFQs you have no realistic chance on, your denominator is much larger than theirs and your rate will look far worse for reasons that have nothing to do with how well you quote.
Which brings us to the actual problem.
The denominator problem
"Quote conversion rate" names at least four different metrics. The same business, in the same month, can honestly report wildly different figures depending on which one it means:
| Rate | Formula | What it tells you |
|---|---|---|
| Request → proposal sent | proposals sent ÷ requests received | How much of your inbound you consider worth quoting |
| Proposal → accepted | accepted ÷ proposals sent | How well your pricing and terms land |
| Request → order | orders ÷ requests received | End-to-end commercial yield |
| Qualified → order | orders ÷ qualified requests | How well you convert real opportunities |
Worked example. A store receives 100 requests. It declines 20 as out of scope and quotes 80. Of those 80, 50 reach a decision and 31 are won.
- Request → order: 31%
- Proposal → accepted: 39%
- Of quotes that reached a decision: 62%
- Counting the 20 declined requests as losses: 31%, but described as a "quote conversion rate" it sounds like a pricing problem rather than a qualification choice
Same month, same business, and figures from 31% to 62% - all defensible. This is why comparing your rate to a published benchmark is close to meaningless unless the benchmark states its denominator, and almost none do.
The corollary: the only comparison that reliably means anything is you versus you, on a definition you wrote down and haven't changed.
Measuring your own
Pick your definitions, write them down, and hold them still. Then segment - because an unsegmented rate hides everything that would let you act on it:
- New versus existing buyers. Repeat accounts convert far higher; blending them masks how you're doing on new business.
- Standard versus custom. Different work, different odds, different timelines.
- Value band. A rate blended across $500 and $50,000 quotes describes neither.
- Response time band. This is how you test the speed hypothesis on your own data instead of importing someone else's multiplier.
- Negotiated versus accepted-as-sent. If most wins involve a counter-offer, your first proposal is priced wrong.
- Reached-a-decision versus expired. A quote that lapsed un-actioned is a follow-up failure, not a pricing one - a distinction the headline rate erases.
Two clocks worth keeping separate, per the trap above: first response (request received → buyer hears from you) and proposal response (request received → priced proposal in their hands). A business that acknowledges in an hour and quotes in three days has a very different problem from one that does neither, and a single "response time" number can't tell them apart.
Four questions for any benchmark you find
- Who published it, and what do they sell? A number on a vendor's site that makes their product look necessary deserves more scrutiny, not less.
- What was the sample? No sample size, no method, no date range - it's an opinion with a decimal point.
- What's the denominator? Especially for anything called a conversion rate.
- When was the data collected? "2026" in the title routinely means a 2011 study re-typed.
If a figure fails all four, you can still use it as a hypothesis about your own business. You just can't use it as a target.
FAQ
What is a good B2B quote-to-order conversion rate?
There's no published benchmark with a disclosed methodology, so any single figure you're offered should be treated with suspicion. The closest credible reference point is the RAIN Group Center for Sales Research finding of a 47% post-proposal close rate from a survey of 472 sellers - but that counts only opportunities that reached the proposal stage, which is probably a narrower denominator than yours. Track your own rate on a fixed definition instead.
What is the average B2B quote response time?
Nobody has published a credible measurement of it. Figures like "24-72 hours" appear on vendor sites without a sample size, source, or date. The rigorous research in this area - Harvard Business Review 2011, the Oldroyd/InsideSales studies - measures lead response, meaning first contact after an enquiry, not the time to deliver a priced quote. They're different operations and shouldn't be conflated.
Is it true that 78% of buyers purchase from the vendor who responds first?
There's no traceable source for it. The claim is attributed across the industry to a "Lead Connect survey" with no published report or methodology, and every citation leads back to other blogs repeating it. The verified findings on response speed are the multipliers from HBR 2011 and the InsideSales/XANT studies - directionally the same message, with actual samples behind them.
Does responding faster to a quote request actually win more deals?
The direction is well supported: across multiple large studies of lead response, speed advantages are real and front-loaded. What isn't supported is any specific multiplier for quoting, because the studies measure first contact rather than priced proposals. The practical takeaway is to split the two - acknowledge quickly, which the research directly supports, then quote as fast as the pricing work genuinely allows.
Why do quote conversion benchmarks vary so much?
Mostly because "conversion rate" names at least four different calculations. Requests-to-proposals, proposals-to-accepted, requests-to-orders, and qualified-to-orders can produce figures from roughly 30% to over 60% for the same business in the same month. Unless a benchmark states its denominator - and most don't - the comparison is meaningless.
How should I measure quote conversion on Shopify?
Shopify's own reports don't cover quoting, because a quote isn't a native Shopify object - only the resulting order is. You need a quote app that records requests, proposals, and outcomes, then pick one denominator, write it down, and segment by new versus existing buyer, standard versus custom, value band, and response time. Compare the trend to your own history, not to a published figure.
Should I use industry benchmarks at all?
As a hypothesis, yes; as a target, no. A benchmark with a disclosed sample and denominator is a reasonable prompt to go and check your own equivalent. A benchmark without one tells you only what its publisher wanted you to believe. Either way, your own trend on a stable definition is the measurement that will actually change a decision.
Where QuotWay fits
QuotWay is a B2B quote and negotiation app for Shopify, built by EFOLI. Its role here is the measurement, not the benchmark: it records every quote as an append-only history - requested, proposed, countered, accepted, declined, expired, converted - so the denominators above are actually computable for your store rather than estimated. The dashboard reports conversion rate, win rate, open pipeline value, and time-to-close on every plan, with date ranges and CSV export from Professional and per-company analytics on Enterprise. We publish no benchmark of our own: the install base isn't large enough for a defensible sample, and a number we couldn't evidence would be exactly the problem this article is about. See analytics and insights, the B2B quote metrics that matter, the plans and pricing, or add QuotWay on Shopify.
Sources
- Oldroyd, J. B., McElheran, K., & Elkington, D. (2011). The Short Life of Online Sales Leads. Harvard Business Review, 89(3). 1.25m leads, 42 companies; audit of 2,241 US firms.
- Oldroyd, J. B. / InsideSales.com (2007). Lead Response Management Study. 3 years of data, 6 companies, 15,000+ leads.
- XANT / InsideSales (2021). Lead Response Management Study. 5.7m leads, 400+ companies, 2018-2020.
- Velocify (2013). The Ultimate Contact Strategy. ~3.5m leads, 400+ companies.
- InsideSales.com (2014). Lead Response Report. Secret-shopper audit, 9,538 companies.
- Drift (2017). Lead Response Report. 433 B2B SaaS companies.
- RAIN Group Center for Sales Research - average sales win rates. Survey of 472 sellers and sales executives.
- Expertise AI - speed-to-lead statistics, verified and debunked. Source-tracing for the folklore claims, including the "78%" figure and the 42/47-hour misquote.
Related articles
See how QuotWay handles this on your store.